RNA Sequencing
RNA sequencing, or RNA-Seq, is the latest technology to study the transcriptome, i.e., the full set of RNA transcripts as genome readouts in a cell or population of cells. This technology directly sequences RNA molecules in the transcriptome in order to determine their genes of origin and abundance. RNA species need to undergo a sequencing library preparatory process prior to sequencing. The libraries are then sequenced to generate millions of reads for each sample. After sequencing, the generated reads are mapped to the reference genome to identify their genomic origin. The total number of reads mapped to a particular genomic region represents the level of transcriptional activity in the region. The more transcriptionally active a genomic region is, the more copies of RNA transcripts it produces, and the more RNA-Seq reads it generates. RNA-seq is essentially a counting game.
NUSeq provides six types of RNA-seq services as detailed below:
- mRNA-Seq: Starts with 25 ng to 1 ug high quality total RNA. Prepares library from poly-A enriched mRNA species. Aims to identify differentially expressed protein-coding genes. Most requested.
- Total RNA-Seq: Starts with 10 ng to 1 ug total RNA. Library prep based on rRNA depletion. Targets both protein-coding genes and long noncoding RNAs. Can accommodate degraded RNA, such as those extracted from FFPE or laser capture microdissected samples.
- Low-input RNA-Seq: Accommodates limited amounts of total RNA. Library prep can be based on poly(A) mRNA enrichment (default, requires 5 to 25 ng RNA), or rRNA depletion (at additional cost, requires 5 to 10 ng RNA).
- Ultra-low-input RNA-Seq: Applies to total RNA input in the range of 10 pg - 5 ng. Library prep is based on SMART-Seq v4 chemistry, which uses oligo(dT) to prime for full-length cDNA generation.
- Small RNA-Seq: Prepares sequencing libraries for small RNA species, e.g., miRNAs, from total RNA. Can start from 100 ng to 1 ug (standard input) or 5 to 100 ng (low input) total RNA.
- Single-Cell RNA-Seq
Users who are new to bulk RNA-seq may refer to core documents RNA-Seq Workflow Steps and Examples, and the RNA-Seq Decision Tree to help decide the type of RNA-seq service needed.
RNA-Seq Library Prep Pricing
Library construction costs for the different types of RNA-Seq are listed on the Core Pricing page.
RNA Sequencing
Read Length and Sequencing Depth
Standard mRNA- or total RNA-Seq: Single-end 50 or 75bp reads are mostly used for general gene expression profiling. To study alternative splicing variants, paired-end, longer reads (up to 150 bp) are often requested. On sequencing depth, 20-25 million reads per sample are usually appropriate for general gene expression profiling, while 40-50 million reads are suggested for splicing variant detection.
Low-input or ultra-low-input RNA-seq: Read length remains the same as standard mRNA- or total RNA-seq. Sequencing depth may be reduced to some extent based on the amount of starting material.
Small RNA-seq: NUSeq generates single-end 50 or 75 bp reads for small RNA-seq. The suggested sequencing depth is 4-5 million reads per sample.
Service Request
Project consultation is provided free-of-charge. RNA-seq services can be requested through NUcore.
Sample Submission
NUSeq takes extracted total RNA for RNA-seq (no tissues or cells). The quality of RNA is the single most important factor that determines final outcome. After sample drop-off, core staff conducts sample QC, which includes Qubit concentration measurement and Bioanalyzer-based RNA Integrity Number (RIN) generation, prior to library construction. A RIN of 7 is required to proceed with mRNA-seq library construction. Submitted RNA samples also need to be DNA-free and we suggest to always include a DNase treatment step during RNA extraction. Presence of genomic DNA contamination is visible on Bioanalyzer traces in the range of 4-10 kb.
In situations under which RNA degradation is unavoidable, such as when using FFPE tissues, total RNA-seq is suggested as it is less dependent on the intactness of RNA.
Bioinformatics
Data analysis is provided upon request. Standard RNA-seq bioinformatics service includes sequencing data QC, alignment, normalization, and differential expression analysis. Learn more about bioinformatics services.
Frequently Asked Questions
Should I make an appointment to discuss my RNA-seq project?
Yes, especially when using the NUSeq facility for the first time. It will provide you the opportunity to give some background and describe the goals of the experiment, which is very beneficial for us. Moreover, it gives us the opportunity to make recommendations, which will increase the likelihood of a successful experiment. Please make an appointment for your consultation.
How much does RNA-seq cost?
This is one of the most frequently asked questions, and unfortunately, one of the most difficult to address because the answer depends on several factors. A typical RNA-seq experiment involves three stages: 1) library construction, 2) sequencing, and 3) analysis. The first stage, library construction, is priced per sample. The choice of library depends on the goals of the experiment. For example, library construction may involve total RNA (coding and non-coding RNA), mRNA, or small RNA. Additionally, library construction may also require special kits for amplification if the amount of starting material is insufficient (ultra-low input). All of these considerations factor into the price.
The second stage is sequencing, and this is priced per flowcell (NextSeq500) or per lane (HiSeq4000). Due to the tremendous output from sequencing instruments, most projects involve multiplexing several samples per flowcell or per lane. The price of the flowcell or lane is fixed; therefore, the price per sample depends on how many samples are multiplexed together. The more samples that are multiplexed per flowcell, the lower the price per sample (but also less data per sample).
The last phase is the analysis, which starting in FY17 is priced per project depending on how many lanes are used, or how much of the flowcell is used. Most RNA-seq projects involve the same set of components such as alignment, gene quantification, differential expression, and pathway analysis. Therefore, we provide these services as a bundle for a flat fee. Because the number of samples is inherently linked to the number of lanes or flowcells that are used for sequencing, the cost of analysis is calculated based on the number of lanes/flowcells. There is an option for custom analysis if the standard analysis is insufficient for the goals of the project. However, the custom analysis is priced at an hourly rate.
How many reads do I need for each sample?
The number of reads per sample depends on the size of the transcriptome and the goals of the experiment. In RNA-seq, only a small percentage of the transcriptome is actually sampled by sequencing. Ideally, the subset that is sampled should accurately reflect the total RNA population, but this is not guaranteed due to inherent bias from amplification during library construction. Transcripts with low expression are less likely to be represented in the library. As more of the library is sequenced, resolution of the transcriptome will be increased. The size of the transcriptome is also important because if more transcripts are expressed in the organism, more reads will be required to adequately represent the transcriptome.
For a standard mRNA- or total RNA-seq experiment involving the comparison of gene expression profiles, between 20 million and 25 million mappable reads are recommended for human and mouse, according the ENCODE RNASeq Standards V1.0. For other organisms, the number of mappable reads can be scaled accordingly, depending on the size of the transcriptome. If the size of the transcriptome is not known, the sizes of the genomes can be used as a surrogate to estimate the needed depth of sequencing.
The goals of the RNA-seq experiment will also determine how many reads are needed. For projects involving splicing isoform expression, at least 40-50 million reads are required for accurate resolution of the transcriptome for human or mouse. However, if interested in isoform expression, please consult the answer to Gene expression versus isoform expression? (below).
For small RNA-seq, beyond 5 million reads Metpally et al. observed very little improvement in the detection of unidentified miRNA species. For most cell types, 4-5 million raw reads per sample are recommended.
How many samples should I multiplex on a flowcell or lane?
This follows from the previous question. Once the number of reads per sample has been determined, the number of samples per flowcell is a simple calculation. The total number of reads obtained per flowcell or lane is relatively consistent, with some variation. To find the number of reads per flowcell or lane, simply divide the number of expected reads by the number of reads required per sample. It is better to make conservative estimates in the event that the number of reads is lower than expected.
Should I select single-end or paired-end reads?
With Illumina technology, sample libraries may be sequenced from one side of library fragments (single-end sequencing) or from both sides of library fragments (paired-end sequencing). In paired-end sequencing, the results are stored as two files: one for the forward reads and another for the reverse reads. Single-end sequencing has a lower price, but paired-end delivers more data.
For projects involving the comparison of gene expression profiles, single-end reads is recommended. Gene expression is estimated by counting the number of alignments to each gene. Consequently, paired-end reads pose somewhat of a dilemma because each cDNA fragment will be counted twice. While this is acceptable for comparing gene expression between samples within the current experiment, it poses a challenge when attempting to compare gene expression between different experiments that have used single-end sequencing. As a result, many RNA-seq analysis strategies count fragments rather than reads per gene. If one end of the fragment is sequenced, it is counted once in the analysis, but if both ends are sequenced, the software still counts the fragment only once. Therefore, the second read is unnecessary.
Paired-end sequencing is recommended for RNA-seq projects aimed at identifying different splicing isoforms or for detecting novel genes, gene fusions, and/or novel transcripts. In these projects, the presence of the second read is beneficial because 1) it may reduce alignment ambiguities, 2) it doubles the likelihood of detecting splice junctions, and 3) it provides positional information to the analysis software, which can help discriminate between isoforms. Although cDNA is sequenced, the reads are typically mapped back to the genome rather than the transcriptome. Due to pre-mRNA splicing, paired-end reads that are in close proximity on the transcript may be quite distant in the genome. This, along with the fragment length distribution, may provide information to the analysis software about exon usage between the paired-end reads. For example, a skipped exon may result in paired-end reads aligning to genome with an inner distance that is less than expected.
If considering isoform expression, please see Gene expression versus isoform expression?
Should I pool my RNA samples?
Pooling RNA samples is sometimes beneficial but should usually be avoided unless necessary. Pooling samples may help stabilize average gene expression values, but information about the variance is lost. Therefore, the pooled RNA must be counted as a single replicate, regardless of how many individual samples went into the pool. Statistically, it is generally preferable to sequence individual samples separately instead of pooling. Pooling is recommended in situations when a single sample does not yield enough total RNA for library construction.
How much RNA do I need?
Library complexity is very important in an RNA-seq experiment. If the starting RNA is limited, amplification artifacts are more likely to occur which affects the interpretation of the results.
The standard protocol for library construction requires between 100 ng and 1 μg of total RNA. There are kits available for ultra-low RNA input that start with as little is 100 pg of RNA; however, the reproducibility increases considerably when starting with 1-2 ng. If possible, 1 to 1.5 ug of total RNA is preferred for sample QC and library prep.
My RNA samples contain genomic DNA contamination. How to clean them up?
Can I submit my own pre-made libraries?
Yes. But you must provide NUSeq the barcodes sequences you used for multiplexing in order to avoid conflict with samples from other projects that may be sequenced on the same flowcell. If your libraries require special (non-Illumina) primers, we may require that you provide them along with your libraries. Note that the success of sequencing is dependent on the quality of the libraries. We will conduct library QC and quantification for pre-made libraries but cannot guarantee the success of the sequencing run when the libraries are not made in our facility.
Gene expression versus splicing isoform expression?
Many genes in eukaryotes are expressed in multiple isoforms that are created by alternative splicing of pre-mRNA. Different isoforms of the same gene may have different biological activity, so knowledge of the expressed isoforms may be of interest. However, short read technologies such as Illumina make determining isoform expression extremely challenging because it is difficult to determine whether independent reads were derived from the same or different isoforms of the same gene. For example, consider a read that aligns to an exon that is common to multiple isoforms. Knowing which particular isoform that the read came from is difficult.
Nevertheless, there are some clues that assist RNA-seq software in assigning reads to various isoforms. For example, reads that overlap unique splice junctions can be used to quantify the expression of the isoform. For this purpose, longer paired-end reads are preferred because there is a greater chance of more reads covering splice junctions. However, in most cases, it is still unclear whether two or more independently covered splice junctions are from the same isoform or different ones. The exception is when both forward and reverse reads of paired-end sequencing happen to overlap separate splice junctions. This is related to identifying novel isoforms rather than quantifying known ones.
Another clue in determining isoform expression comes from the mapping distance between the forward and reverse reads in paired-end sequencing. This is possible because while the transcriptome is sequenced as cDNA (without introns), the reads are aligned to the genome (with introns). The cDNA fragment size follows a nearly normal distribution; therefore, paired-end reads have an expected insert size, which translates to an expected distance between them following alignment. When aligning paired-end reads to the genome, the genomic distance between the aligned paired-end reads can help determine exon usage. For example, consider a scenario in which an exon is skipped in one particular isoform. Any paired-end reads that flank the skipped exon will align in closer proximity on the genome than otherwise expected. However, a challenge still remains due to variation in the cDNA fragment size. If the length of an exon is near the standard deviation of the fragment size, it’s inclusion or exclusion is difficult to determine.
RNA-seq tools exist that perform isoform expression with short reads, but their accuracy is questionable, and any results should be validated by other means. Moreover, the sequencing depth must be very high to provide enough observations for the software to assign reads to isoforms as accurately as possible. More reads will give higher resolution to the transcriptome, but 50 million to 100 million paired-end mapped reads are recommended at a minimum. If isoform expression is critical to the goals of the experiment, then longer read technologies may be worth considering. Although the error rate is high, the NGS platform from Pacific Biosciences (Pac Bio) offers read lengths that average over 10 kb. This is often long enough to sequence the entire isoform in one read, thereby removing any ambiguity of exon usage and splice junction sites. However, sequencing the entire transcriptome with Pac Bio is very expensive. It is only recommended when sequencing a limited number of targeted transcripts.
How many biological replicates do I need to achieve statistical significance?
First it is important to recognize the difference between biological replicates versus technical replicates. Biological replicates should be sequencing libraries that have been constructed from independent biological entities (e.g. mice, patients, tissue cultures). Technical replicates, however, are libraries constructed from the same biological entity, or multiple sequencing rounds of the same library. The benefit of running technical replicates is to evaluate the reproducibility of the technique, which is often outside the goals of most RNA-seq experiments.
There is no minimum number of replicates that will guarantee a good RNA-seq experiment. It is dependent on many factors and can vary considerably. When trying to decide how many replicates per group, the best advice is, 'the more, the better.' Therefore, it’s best to use as many replicates as you can comfortably afford.
Despite the fact that thousands of genes are analyzed in a single RNA-seq experiment, it is not a multivariate analysis, but rather thousands of univariate analyses – one for each gene. In every univariate analysis, the biggest factor that determines statistical significance is the variance within groups compared to the variance between groups. It is almost certain that the average expression will vary in every gene between the groups in the comparison. That is, suppose the experiment involves two conditions, the average expression of every gene will certainly be different between the conditions. The question is whether this observed difference is statistically significant or due to biological variation and/or noise. This is where variance plays a key role. Even if each group contains only one sample, it is likely that some genes will be classified as differentially expressed. This is possible with one sample per group because many RNA-seq software packages can estimate the variance through alternative – albeit less than ideal – approaches. In cases such as this, only genes that are very different between groups will be considered significant. Conversely, when replicates are included, the software can better estimate the variance at each gene. More replicates lead to better estimates, which often (but not always) leads to more genes that can be confidently classified as differentially expressed.
One important thing to note is that the number of differentially expressed genes can vary greatly between experiments, even if the same number of replicates were used. Some RNA-seq experiments with two replicates per group result in hundreds of differentially expressed genes, and other experiments with three or more replicates result in only a few. This is again due to the variance between replicates. When gene expression is consistent among the replicates in each group, the variance is low, and more genes can be confidently classified as differentially expressed. On the other hand, when gene expression varies greatly among the replicates, the variance is high, and the software will classify few – if any – genes as differentially expressed. Unfortunately, the variance among the replicates and between groups can only be revealed after sequencing is complete.
What is the turnaround time for an RNA-seq project?
Turnaround time depends largely on the volume of activity at the time of sample submission and the complexity of the project. Given typical workloads, library construction and sequencing requires approximately 2-3 weeks, and analysis often requires approximately two to three weeks after that.
Can I perform the RNA-seq analysis on my own?
Yes. There is no obligation to use the NUSeq core for bioinformatics analysis.
Can the NUSeq core provide RNA-seq analysis on samples that were sequenced elsewhere?
Yes. We offer bioinformatics analysis on samples that were not sequenced in our core.
How are genes identified as differentially expressed?
In the early days of differential gene expression, a fold change in expression that was greater than 2 or less than -2 was often considered significant. However, this approach is not statistically robust. Currently, a hypothesis test comparing mean expression values is performed for each gene and a p-value is calculated to represent the probably of incorrectly rejecting the null hypothesis.
Because a typical RNA-seq experiment evaluates tens of thousands of genes concurrently, the so-called multiple-test correction must be considered. A p-value represents the probability of incorrectly rejecting the null hypothesis, and a p-value of 0.05 (or 5%) is the generally accepted cutoff for determining whether the difference is statistically significant. To illustrate the problem, imagine if each of differentially expressed genes has a p-value of 0.05, this means that on average 1 in 20 of those differentially expressed genes will be incorrectly classified. Therefore, if the analysis identifies hundreds of genes as significantly different, potentially dozens of them may be incorrect. To avoid this, a multiple hypothesis correction is applied, often applying the Benjamani-Hochberg false discovery rate (FDR). Using this procedure, the p-values are corrected and the FDR-adjusted p-values are calculated. These FDR-adjusted p-values are taken into consideration when determining whether genes are differentially expressed. As with traditional p-values, and FDR-adjusted p-value less than or equal to 0.05 is typically the cutoff to determine statistical significance.
Why don’t my samples cluster well on a dendrogram?
We routinely provide some general plots of the RNA-seq data, one of which is a dendrogram illustrating the relationship between samples. These dendrograms are based on the multivariate distance (usually the Euclidean distance) between each sample using the expression values of each gene. Ideally, biological replicates from each group should cluster together on the dendrogram, but this is not always the case. The simplest explanation why they don’t cluster as expected is because the gene expression profiles are too variable and/or inconsistent between replicates within a group. Biologically, this can occur from a number of scenarios. For example, perhaps the gene expression profiles in the treatment group are not considerably different from the control group. That is, the treatment had little effect on gene expression. Another example is when biological replicates are prepared at different times. Gene expression can be very sensitive and small changes in sample preparation can have an influence (see Why should I prepare my RNA samples all at once?). A final example is that some projects simply involve inherently variable samples. This often occurs in projects involving RNA prepared from human patients. The inherent variability among patients sometimes leads to different gene expression profiles.
While cleanly separated samples on the dendrogram usually result in a greater number of differentially expressed genes, the experiment is not lost if the samples do not separate well. In many cases, differentially expressed genes can still be identified and the project can move forward.
Can I sequence some replicates now, evaluate the results, and then sequence more replicates if needed?
Yes, but there are some important caveats to consider. Data from different sequencing runs can be combined and re-analyzed. If you prefer to sequence some samples now, but evaluate the results before sequencing the rest, it is strongly encouraged to prepare the input RNA for all potential RNA-seq samples at the same time. If planning to sequence more samples at a later date, store the input RNA at −80°C until that time. The reason is because gene expression is very sensitive, and any change in conditions between different RNA preparations may result in different gene expression profiles. As a result, the consistency between replicates will suffer, the variance between groups will increase, and the number of genes that are classified as differentially expressed will decrease (see the related questions How many replicates do I need to achieve statistical significance? and Why should I prepare my RNA samples all at once? for more information).
Why should I prepare my RNA samples all at once?
It is best to prepare all the RNA samples at once because of consistency. Gene expression is very sensitive, and despite preparing RNA under identical conditions, there are often measurable differences in expression profiles between samples prepared at separate occasions. Consider the following experiment involving six groups with two replicates per group. In this particular experiment, the first replicates for all six groups were prepared first, and the second replicate at a later date. Even though the experimental conditions and RNA isolation procedures were identical, a clustering analysis of the samples reveals that the first replicates have considerably different expression profiles than the second replicate.
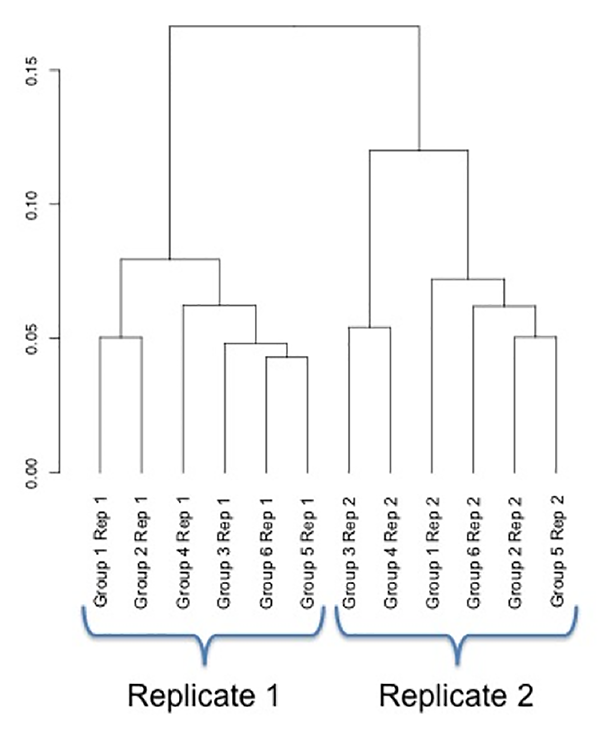
In this dendrogram, the first replicates and the second replicates fall on separate branches. As a result, when averaging the replicates and performing a differential expression analysis, there were no differentially expressed genes between any of the six groups.
On the other hand, consider the following RNA-seq experiment involving four groups, also with two replicates per group. In this experiment, the RNA from all samples was collected at one time.
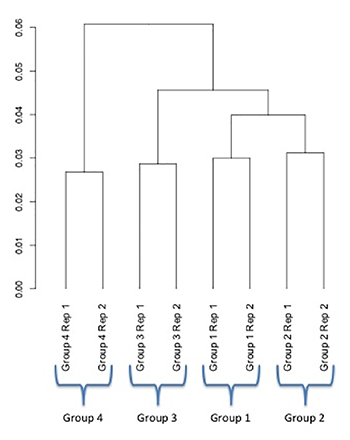
This dendrogram reveals that the individual replicates from each group are very consistent and cluster together, which results in a low variance within groups. When the replicates were averaged and a differential expression analysis was performed, several hundred genes were differentially expressed.
What organisms are available for RNA-seq?
In principle, RNA prepared from any organism can be used in an RNA-seq experiment. However, model organisms including (but not limited to) human, mouse, or rat often result in easier (and faster) analysis. This is because these organisms are very well annotated. That is, the exon boundaries and alternative transcripts are well established (this is not to imply that gene annotation is complete; RNA-seq experiments are continually providing higher transcriptome resolution).
If the organism has a completely assembled genome but no gene annotation, then the RNA-seq analysis will map reads back the genome and identify potential transcripts, but there will be no gene information to accompany those transcripts. Each transcript will be assigned an arbitrary number that will mean nothing outside the context of the analysis. The sequences of those potentially novel transcripts may be searched in known databases such as NCBI to identify putative functions (Blast2GO). An experiment like this may be useful in establishing a gene annotation for the first time.
If the organism lacks a reference genome as well as gene annotation, the sequenced reads may be assembled into a putative transcriptome. The result would be a series of transcripts that have no known function and no location within the genome. This might be useful in part of a larger project, but often other experiments will be needed to make sense of the results.